

Metrics Server — 클러스터 리소스 메트릭 수집
Kubernetes Metrics Server의 역할과 아키텍처, 설치 방법, kubectl top으로 CPU/Memory 사용량 조회, HPA와 VPA에서 활용되는 방식, Metrics Server가 없을 때 발생하는 문제와 트러블슈팅을 다룹니다.
지난 글에서 프라이빗 레지스트리 인증 방법을 살펴봤다. 이번 글에서는 Kubernetes 모니터링의 기초인 Metrics Server를 다룬다. HPA(Horizontal Pod Autoscaler), VPA(Vertical Pod Autoscaler), kubectl top 명령어 모두 Metrics Server에 의존한다. 설치되지 않으면 자동 확장이 동작하지 않는다.
Metrics Server란
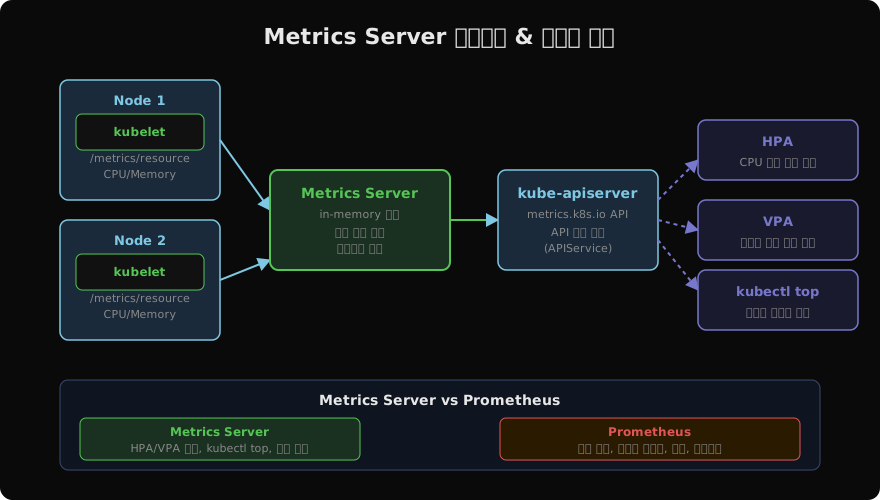
Metrics Server는 kubelet의 /metrics/resource 엔드포인트에서 각 노드와 Pod의 CPU/메모리 사용량을 수집해 metrics.k8s.io API를 통해 노출하는 클러스터 애드온이다. 최신 값만 in-memory에 보관하므로 히스토리 조회는 불가능하다. 장기 모니터링에는 Prometheus가 필요하다.
설치
대부분의 관리형 Kubernetes(EKS, GKE, AKS)는 Metrics Server가 기본 설치되어 있다. 직접 설치가 필요한 경우:
# 최신 버전 직접 적용 (kubectl apply)
kubectl apply -f https://github.com/kubernetes-sigs/metrics-server/releases/latest/download/components.yaml

# 또는 Helm으로 설치
helm repo add metrics-server https://kubernetes-sigs.github.io/metrics-server/
helm upgrade --install metrics-server metrics-server/metrics-server \
  --namespace kube-system

# 설치 확인
kubectl get deployment metrics-server -n kube-system
kubectl top nodes  # 정상 출력되면 설치 완료
kubelet TLS 인증서 문제 해결
로컬 클러스터(kubeadm, minikube)에서 kubelet의 자체 서명 인증서로 인해 오류가 발생할 수 있다.
# metrics-server Deployment에 args 추가
spec:
  template:
    spec:
      containers:
        - name: metrics-server
          args:
            - --cert-dir=/tmp
            - --secure-port=4443
            - --kubelet-preferred-address-types=InternalIP,ExternalIP,Hostname
            - --kubelet-use-node-status-port
            - --metric-resolution=15s
            - --kubelet-insecure-tls    # 개발 환경에서만 사용
프로덕션에서는 --kubelet-insecure-tls 대신 kubelet 인증서를 올바르게 설정해야 한다.
kubectl top으로 리소스 사용량 조회
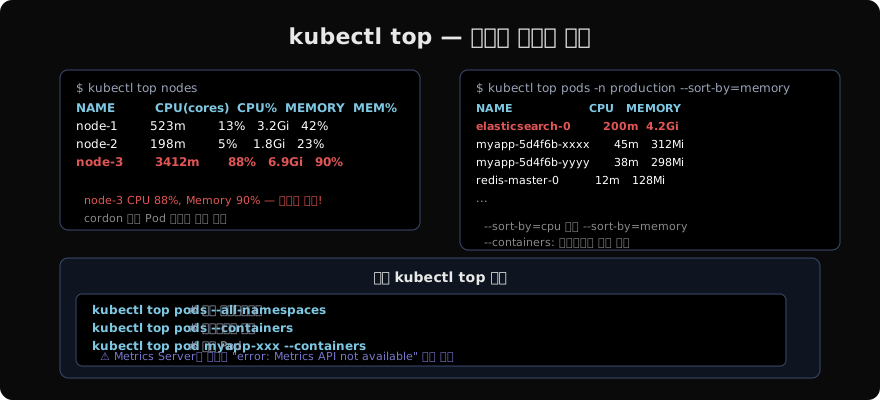
# 노드 리소스 사용량 (CPU cores, Memory)
kubectl top nodes

# 특정 네임스페이스의 Pod 리소스 사용량
kubectl top pods -n production

# CPU 기준 정렬 (메모리가 많은 Pod 찾기)
kubectl top pods -n production --sort-by=memory

# 컨테이너별 사용량 상세 조회
kubectl top pods -n production --containers

# 전체 네임스페이스
kubectl top pods --all-namespaces --sort-by=cpu
Metrics API 직접 조회
kubectl top은 내부적으로 metrics.k8s.io API를 호출한다. API를 직접 조회하면 더 세밀한 데이터를 얻을 수 있다.
# metrics.k8s.io API 확인
kubectl get apiservices | grep metrics

# 노드 메트릭 raw API 조회
kubectl get --raw /apis/metrics.k8s.io/v1beta1/nodes | jq .

# 특정 Pod 메트릭 조회
kubectl get --raw /apis/metrics.k8s.io/v1beta1/namespaces/production/pods/myapp-xxx | jq .
HPA에서 Metrics Server 활용
HPA는 Metrics Server의 CPU/메모리 사용량을 기반으로 Pod를 자동으로 수평 확장한다.
apiVersion: autoscaling/v2
kind: HorizontalPodAutoscaler
metadata:
  name: myapp-hpa
spec:
  scaleTargetRef:
    apiVersion: apps/v1
    kind: Deployment
    name: myapp
  minReplicas: 2
  maxReplicas: 10
  metrics:
    - type: Resource
      resource:
        name: cpu
        target:
          type: Utilization
          averageUtilization: 70    # CPU 70% 초과 시 확장
    - type: Resource
      resource:
        name: memory
        target:
          type: AverageValue
          averageValue: 500Mi       # Pod당 평균 메모리 500Mi 초과 시 확장
HPA가 동작하지 않으면 kubectl describe hpa myapp-hpa로 이벤트를 확인한다. unable to get metrics for resource cpu가 나오면 Metrics Server 미설치 또는 오작동이 원인이다.
트러블슈팅
# Metrics Server Pod 로그 확인
kubectl logs -n kube-system deployment/metrics-server

# API 서버와 Metrics Server 연결 확인
kubectl get apiservice v1beta1.metrics.k8s.io -o yaml

# 조건 확인 (Available: True여야 함)
kubectl get apiservice v1beta1.metrics.k8s.io \
  -o jsonpath='{.status.conditions[0]}'

# Metrics Server가 각 kubelet에 연결할 수 있는지 확인
kubectl describe nodes | grep -E "InternalIP|Hostname"
APIService v1beta1.metrics.k8s.io의 Available 조건이 False이면 Metrics Server와 API 서버 간 연결 문제다. Metrics Server Pod 로그에서 dial tcp <node-ip>:10250: i/o timeout 같은 오류를 확인하고 네트워크 정책을 점검한다.
지난 글: Image Pull Secrets — 프라이빗 레지스트리 인증
다음 글: Prometheus — Kubernetes 모니터링 기초
읽어주셔서 감사합니다. 😊
PALDYN / ARTICLE AI
글의 개념, 수식, 코드에 대해 물어보세요.
질문과 관련된 문단을 골라 답변의 문맥으로 사용합니다.생각 중 · 0초